
Decision Intelligence & Advanced Analytics
Define what to measure, govern how AI and BI calculate it, and tie every metric to a clear decision.
Dashboards and AI copilots fail when two analysts: or two AI prompts: ask the same business question and return two different numbers. We design the KPI architectures, decision-support models, and executable semantic layers (SimBI ADI) that turn raw operational data into consistent, defensible decisions.
What we design & govern
KPI architecture & metric tree design
Structured hierarchies linking board-level strategic outcomes down to operational indicators, with unambiguous mathematical definitions and owners.
Executable metadata & AI policy engines
Govern how LLMs, MCP agents, and BI tools query your data using SimBI ADI: enforcing deterministic SQL/DAX compilation and policy gates before execution.
Executive decision-support & scenario models
Quantitative scorecards, risk thresholds, and sensitivity models that translate complex market or operational signals into clear action triggers.
Cross-platform semantic layer alignment
Ensure a metric means the exact same thing whether queried in Power BI, Plotly Dash, Python notebooks, or an AI assistant.
Exploratory analytics & network surveillance
Deep-dive statistical segmentation, concentration analysis, and counterparty network modeling structured for repeatability.
Board & regulatory narrative synthesis
Structured analytical frameworks that connect metric variance to defensible, audit-ready commentary for investment committees and regulators.
Featured Dashboards & Case Studies
Real production deliverables engineered for global financial regulators, institutional risk teams, and capital markets organizations.
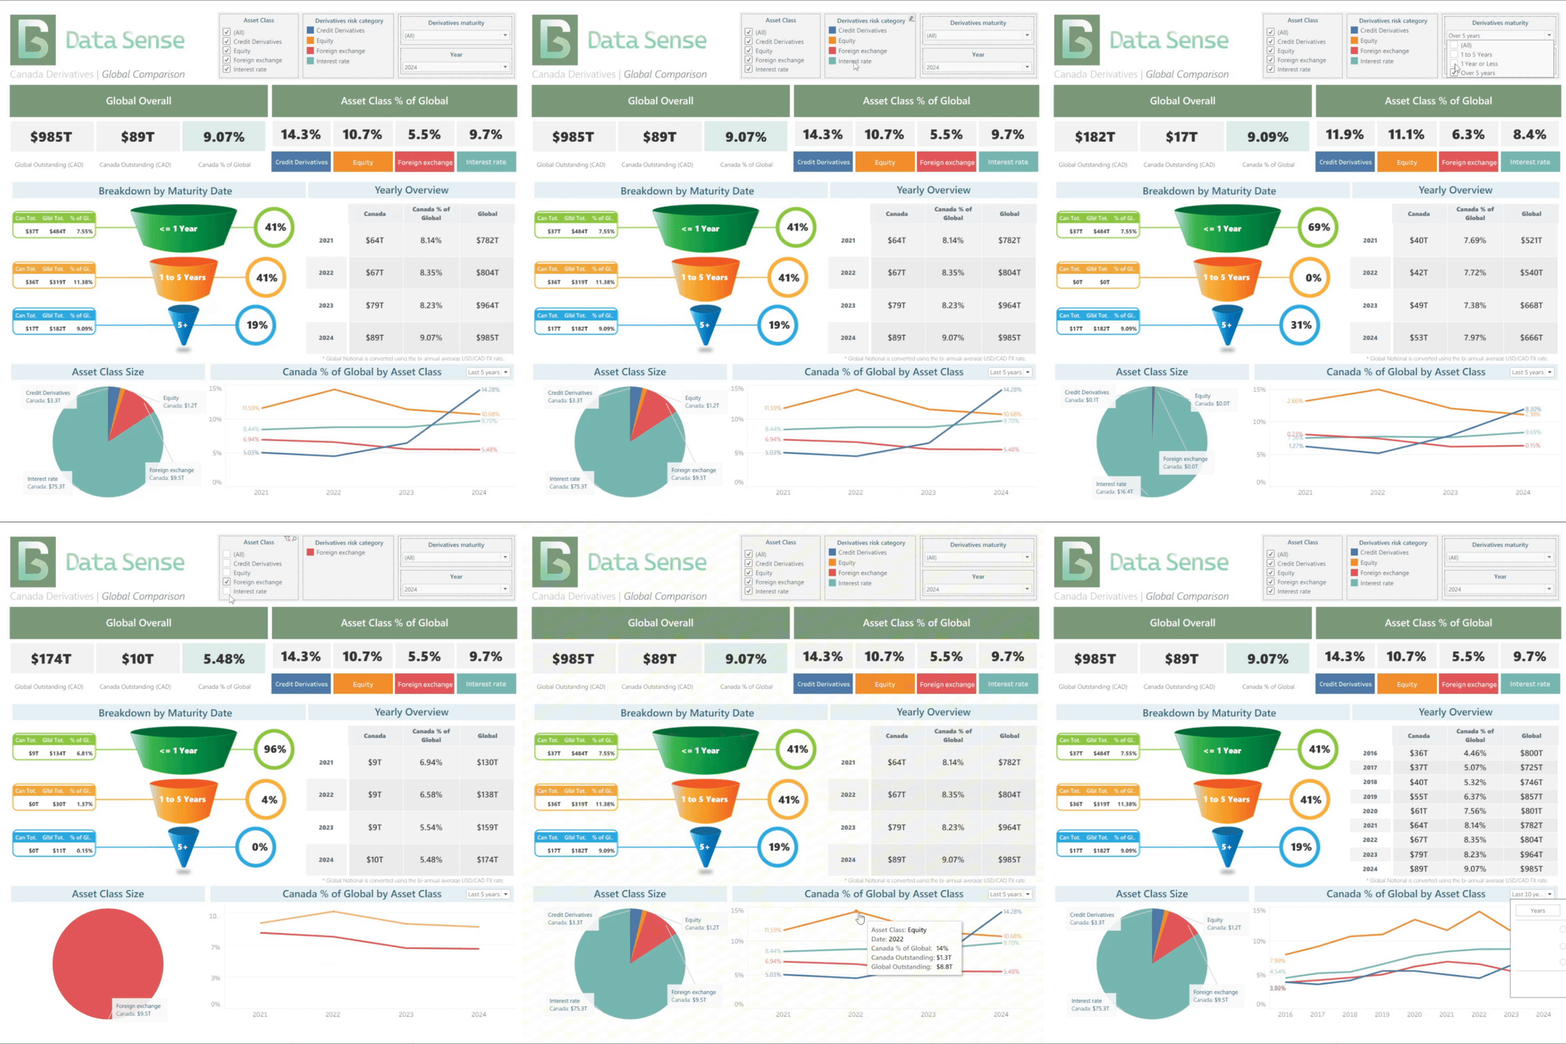
Executive OTC Derivatives Decision Architecture
See how restructuring KPI hierarchy around concentration risk and market share velocity transformed an ignored report into an executive decision tool.
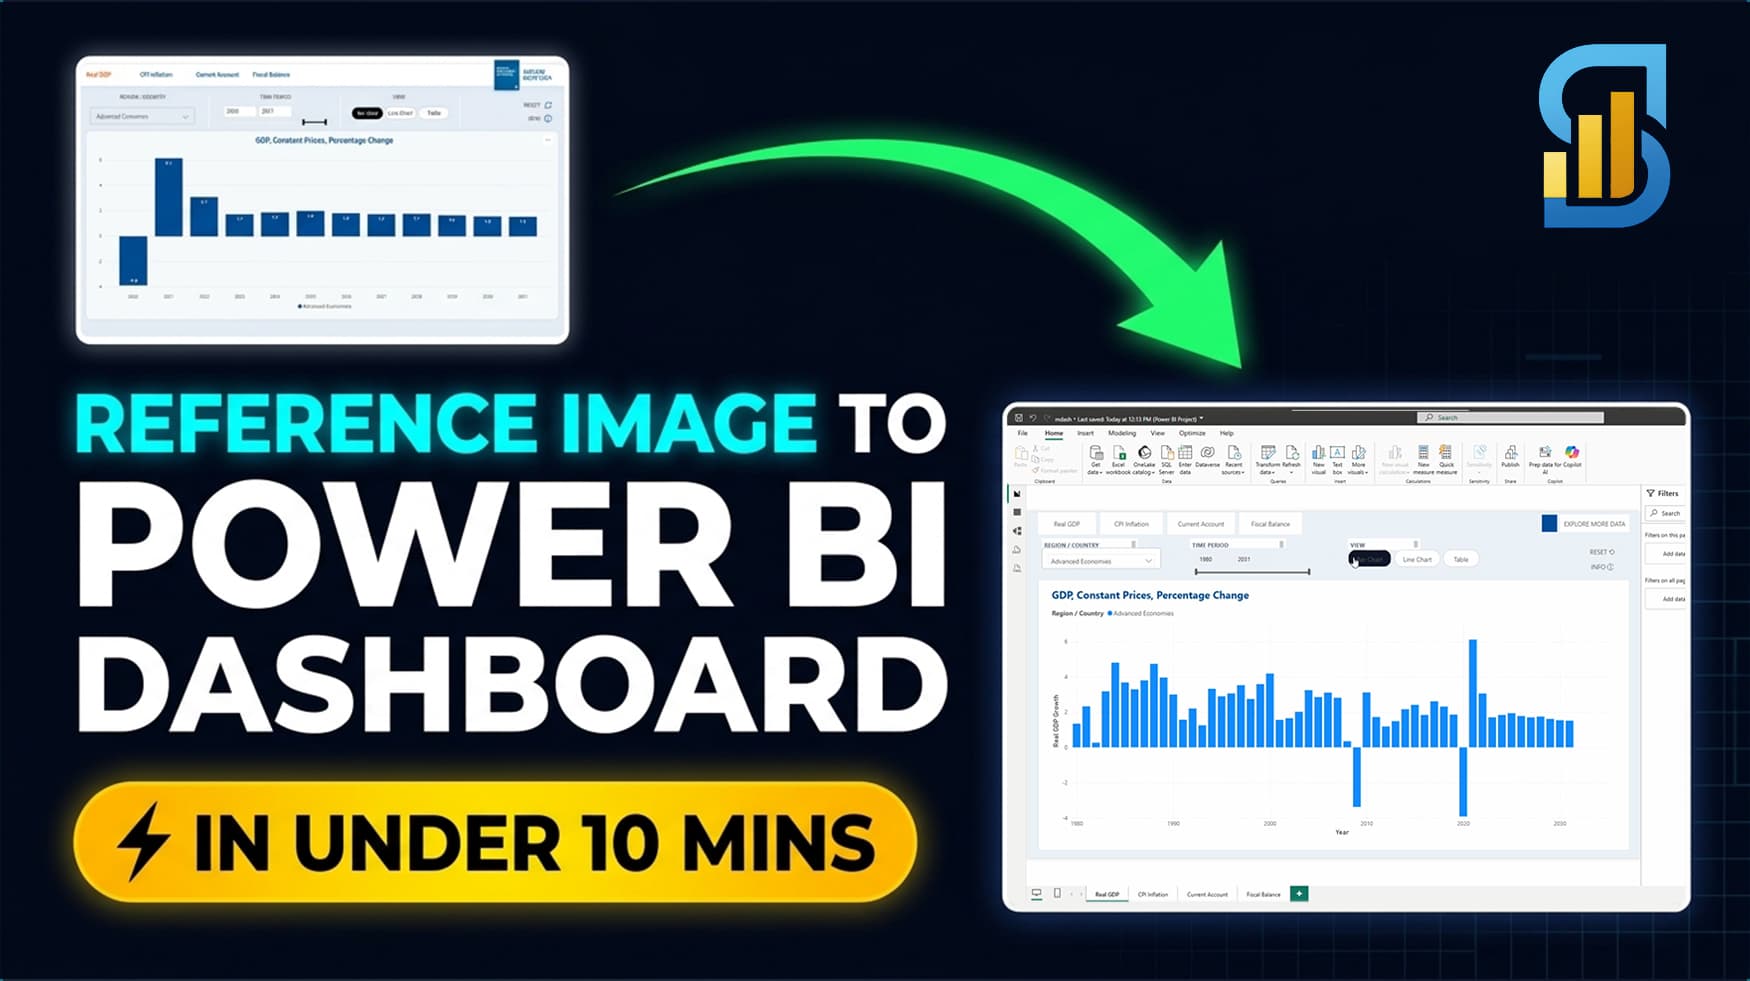
SimBI & Power BI MCP Semantic Automation
Bridging semantic intent and physical BI execution so AI agents and human analysts always build from governed metric definitions.
Who this is for
- Executives, CFOs, and strategy leaders tired of debating which report has the 'right' number in meetings
- Organizations deploying AI assistants or MCP agents over financial data that cannot afford hallucinated metrics
- Risk, compliance, and policy teams designing market surveillance or institutional performance scorecards
- Data teams scaling beyond ad-hoc SQL requests into a governed, reusable semantic metric layer
- Boards and investment committees requiring rigorous, methodologically transparent analytical reporting
Why Data Sense
Decision-backward engineering
We start with the decision your leadership needs to make and work backward to the exact KPI thresholds, semantic definitions, and data pipelines required.
Deterministic AI & BI alignment
Through our work on SimBI ADI and executable metadata, we eliminate semantic drift between human dashboards and AI-generated insights.
Institutional financial rigor
Led by an FRM-certified principal with 15+ years across global regulatory bodies and capital markets, ensuring every model withstands scrutiny.
Frequently Asked Questions
What is decision intelligence analytics and how does it differ from traditional BI?
Traditional business intelligence focuses on descriptive reporting: displaying historical metrics on a dashboard. Decision intelligence designs the KPI hierarchy, semantic contracts, thresholds, and scenario models that connect those metrics directly to operational and strategic decisions across both human workflows and AI systems.
Why do AI copilots and BI dashboards return conflicting answers to the same question?
When LLMs generate raw SQL from natural language or analysts build isolated Power BI reports, they guess joins, filters, and date boundaries differently each time. Solving this requires an executable semantic layer and AI policy engine (like SimBI ADI) that forces both BI tools and AI agents to resolve business terms through a single governed calculation graph.
How do you design an institutional KPI framework?
We map your strategic objectives into a structured metric tree, documenting each indicator's mathematical formula, grain, authoritative source table, exclusions, owner, and decision threshold. We then encode those definitions directly into your semantic layer so they cannot drift.
Who benefits most from decision intelligence consulting?
Finance, risk, strategy, and regulatory teams that have outgrown ad-hoc dashboards and need consistent, audit-ready metric definitions across executive reporting, board packs, and AI-enabled analytics.
Ready to talk?
Tell us about your data challenge and we'll show you exactly how we'd approach it. No obligation.
Get a Free Consultation →